


By the numbers
59
Total companies in Aerospace and Geospatial on Crunchbase
$3,052,545,243
Funding in Aerospace and Geospatial companies since Jan 1, 2020 according to Crunchbase (across 25 companies and 70 rounds)
42%
Of those companies founded after 2015
2
Number of months that it took Dr. Qiusheng Wu’s samgeo, or segment-geospatial Python package, to reach 1,700 stars on GitHub, compared to 2 years for the leafmap project.
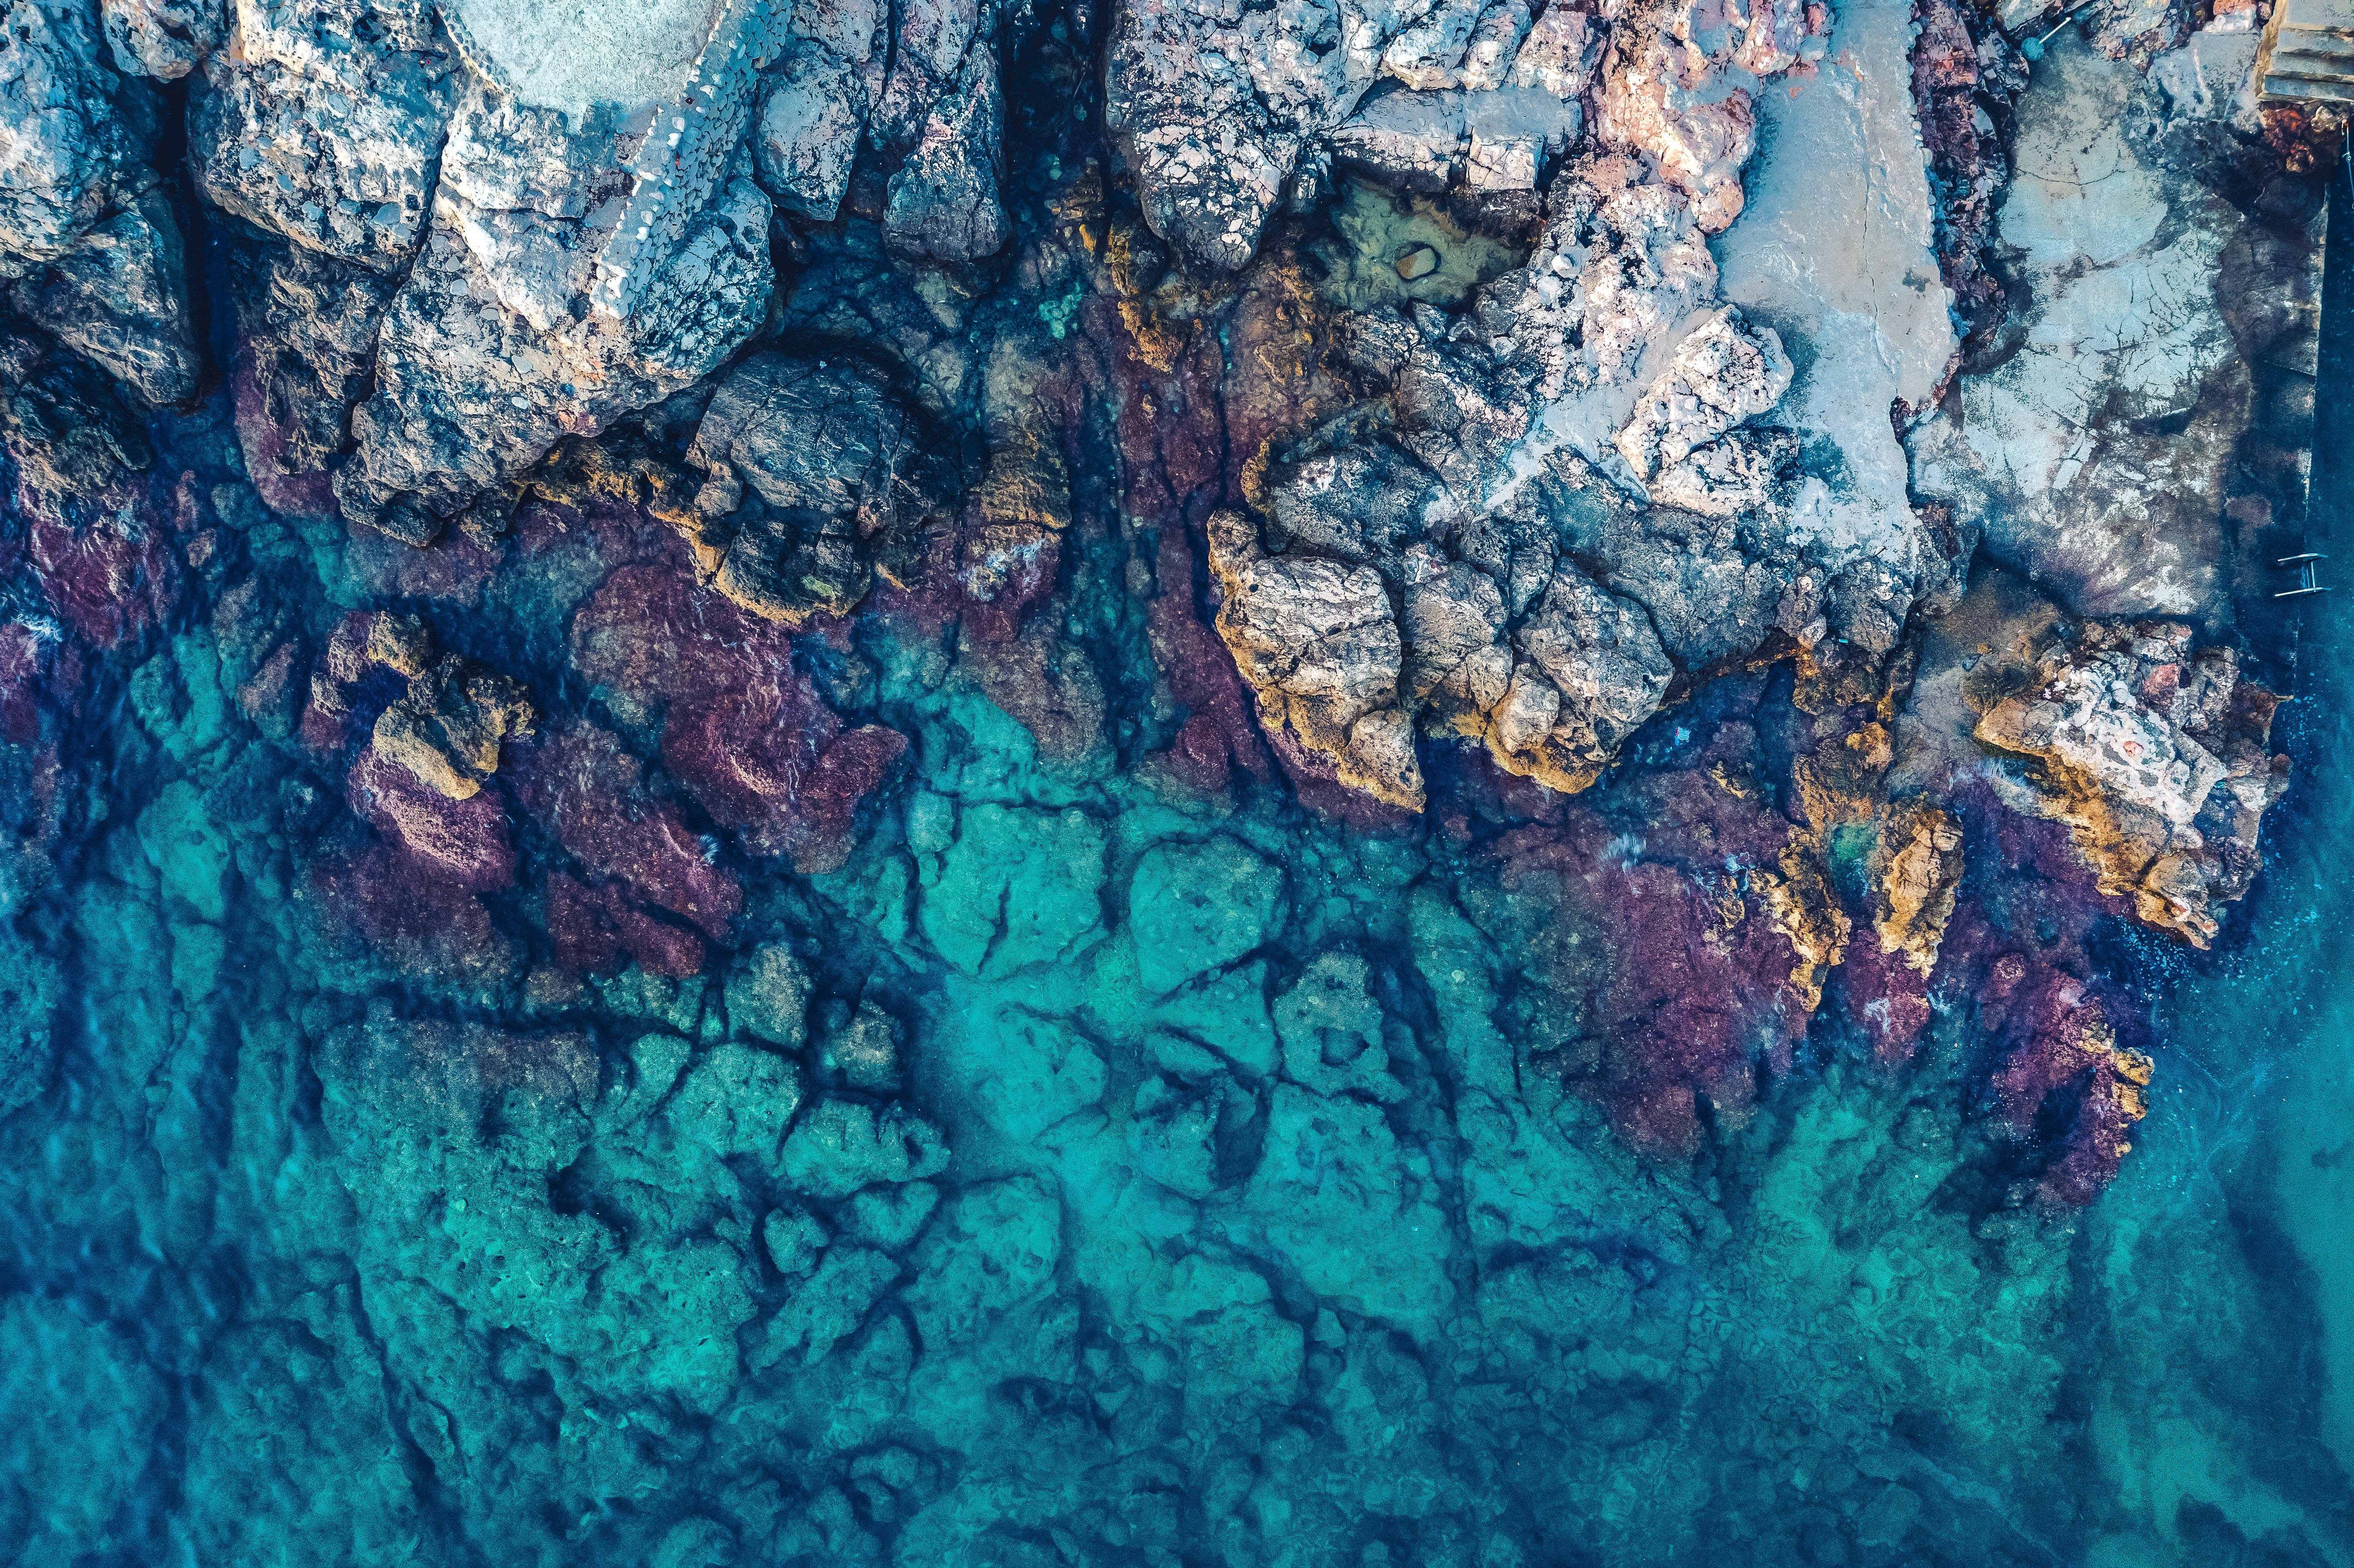
Why imagery and raster data are having a moment
To me, it is still strange that one of the primary data types in GIS and spatial analytics is in fact an image. To date, I haven’t heard of another practice in analytics or data science (that isn’t focused on images such as health imagery or photo classification) that uses images as a core data type. In fact, there are 160 different raster data types currently supported by GDAL with names like “RIK -- Swedish Grid Maps”, “JDEM -- Japanese DEM (.mem)”, and “GSBG -- Golden Software Binary Grid File Format”.
Why do we use rasters anyways?
It comes down to a few things:
Satellite imagery comes in rasters, so it makes sense to start there
Images represent a contiguous phenomenon such as elevation that is harder to translate into vectors
It’s relatively simple to perform mathematical operations on rasters to do things like interpolation up to machine/deep learning
Oddly enough, it is sort of an efficient data storage method. Try to vectorize a granular (say 10 or 5 meter) DEM to vector across a large area and you will see what I mean
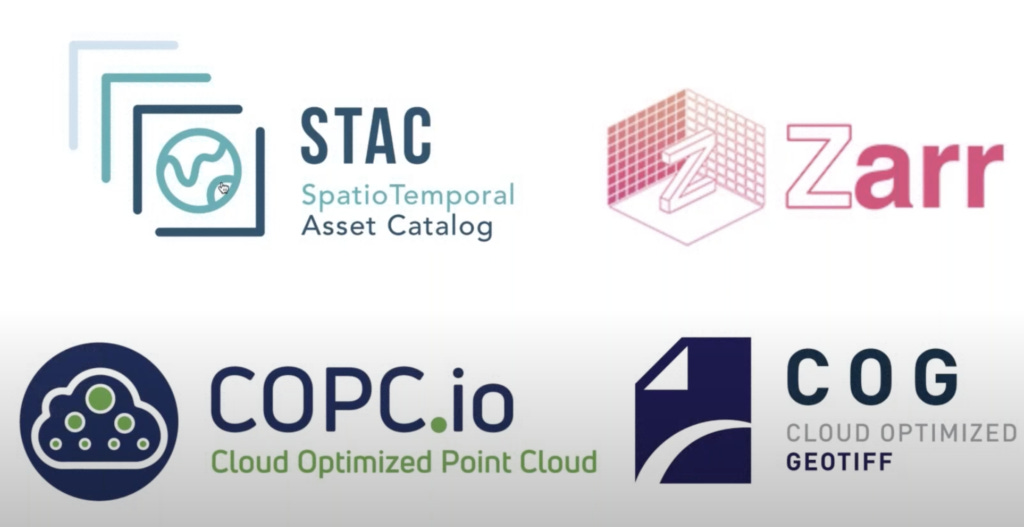
And the continued investment into the ecosystem especially as the temporal frequency of the data grows, as evidenced by new file types like Cloud Optimized GeoTIFF, Cloud Optimized Point Cloud, Zarr, and Spatio-temporal Asset Catalog.
The space is growing
The data in By the numbers tells part of the story, but the growth in the number of companies that have been founded has increased dramatically. This is in part due to the ability to build smaller satellites such as Planet has done as well as growing need for this data. Based on my search you can see the uptick in new companies in this space.

But there are many other companies in the space that are using or creating products on top of imagery, and Aravind who has a great publication on Substack that covers the broader earth observation space in detail (I definitely recommend checking out his Substack). His take on the market in the post “The State of Commercial Earth Observation” does this in fantastic detail and brevity.

Setapp gets you access to 240+ Mac/iOS apps
I found Setapp after using CleanShot X, which I use for all my tutorial videos and every screen shot on my computer, and CleanMyMac X to clear out a bunch of files taking up space. These two apps are among the 240+ that you can access with Setapp for a monthly fee such as VPNs, a clipboard with a full history, menu bar organizer, and app window organization.
They are offering 15% off their new Family Plan until June 22 using this link.
The above are affiliate links. I only recommend things I use and I only share things that I would recommend to you in any other scenario. I may receive a small commission from a purchase at no extra cost, and you may receive an offer as listed above.
My personal favorite is this chart summarizing and organizing the space.

Climate change and ESG are definitely driving the change
As Aravind also argues in the post from the previous year, there is likely a wave of verticalization coming to the earth observation space. And this is no different from other areas when a space becomes crowded, companies tend to focus on specific areas or verticals.
However, an increased focus on climate change and, in particular, environmental, social, and corporate governance (ESG) have only further increased the need for raster data and earth observation. In fact there are a number of comapnies now that are focusing directly on delivering pure insights in a very approachable and easy to use format such as SustGlobal and Climate Engine
Raster data and analysis is getting far more accessible
Raster data is also becoming far more accessible and easy to use. The quality is one major improvement, meaning there are more frequent updates of public data sources of imagery and the quality is better. This post from Rhett Ayers Butler on the impact of remote sensing on forest monitoring, while focusing on one specific problem, shows the benefits across any particular use case.

The tools to use this data have greatly improved as well. There are more packages than ever to visualize and analyze geospatial, and the G.O.A.T. of this space is Dr. Qiusheng Wu of the University of Tennessee. He created geemap and leafmap which are two of the most comprehensive Python packages for remote sensing and more.
But the newest contender has grown faster than both of these packages: segment-geospatial or samgeo. Here is an example from this post of segmenting buildings just by adding control points of the foreground and background.
Not only that but you can simply ask it to find trees and it does it for you, something that would take a lot of coding and work even in recent years.
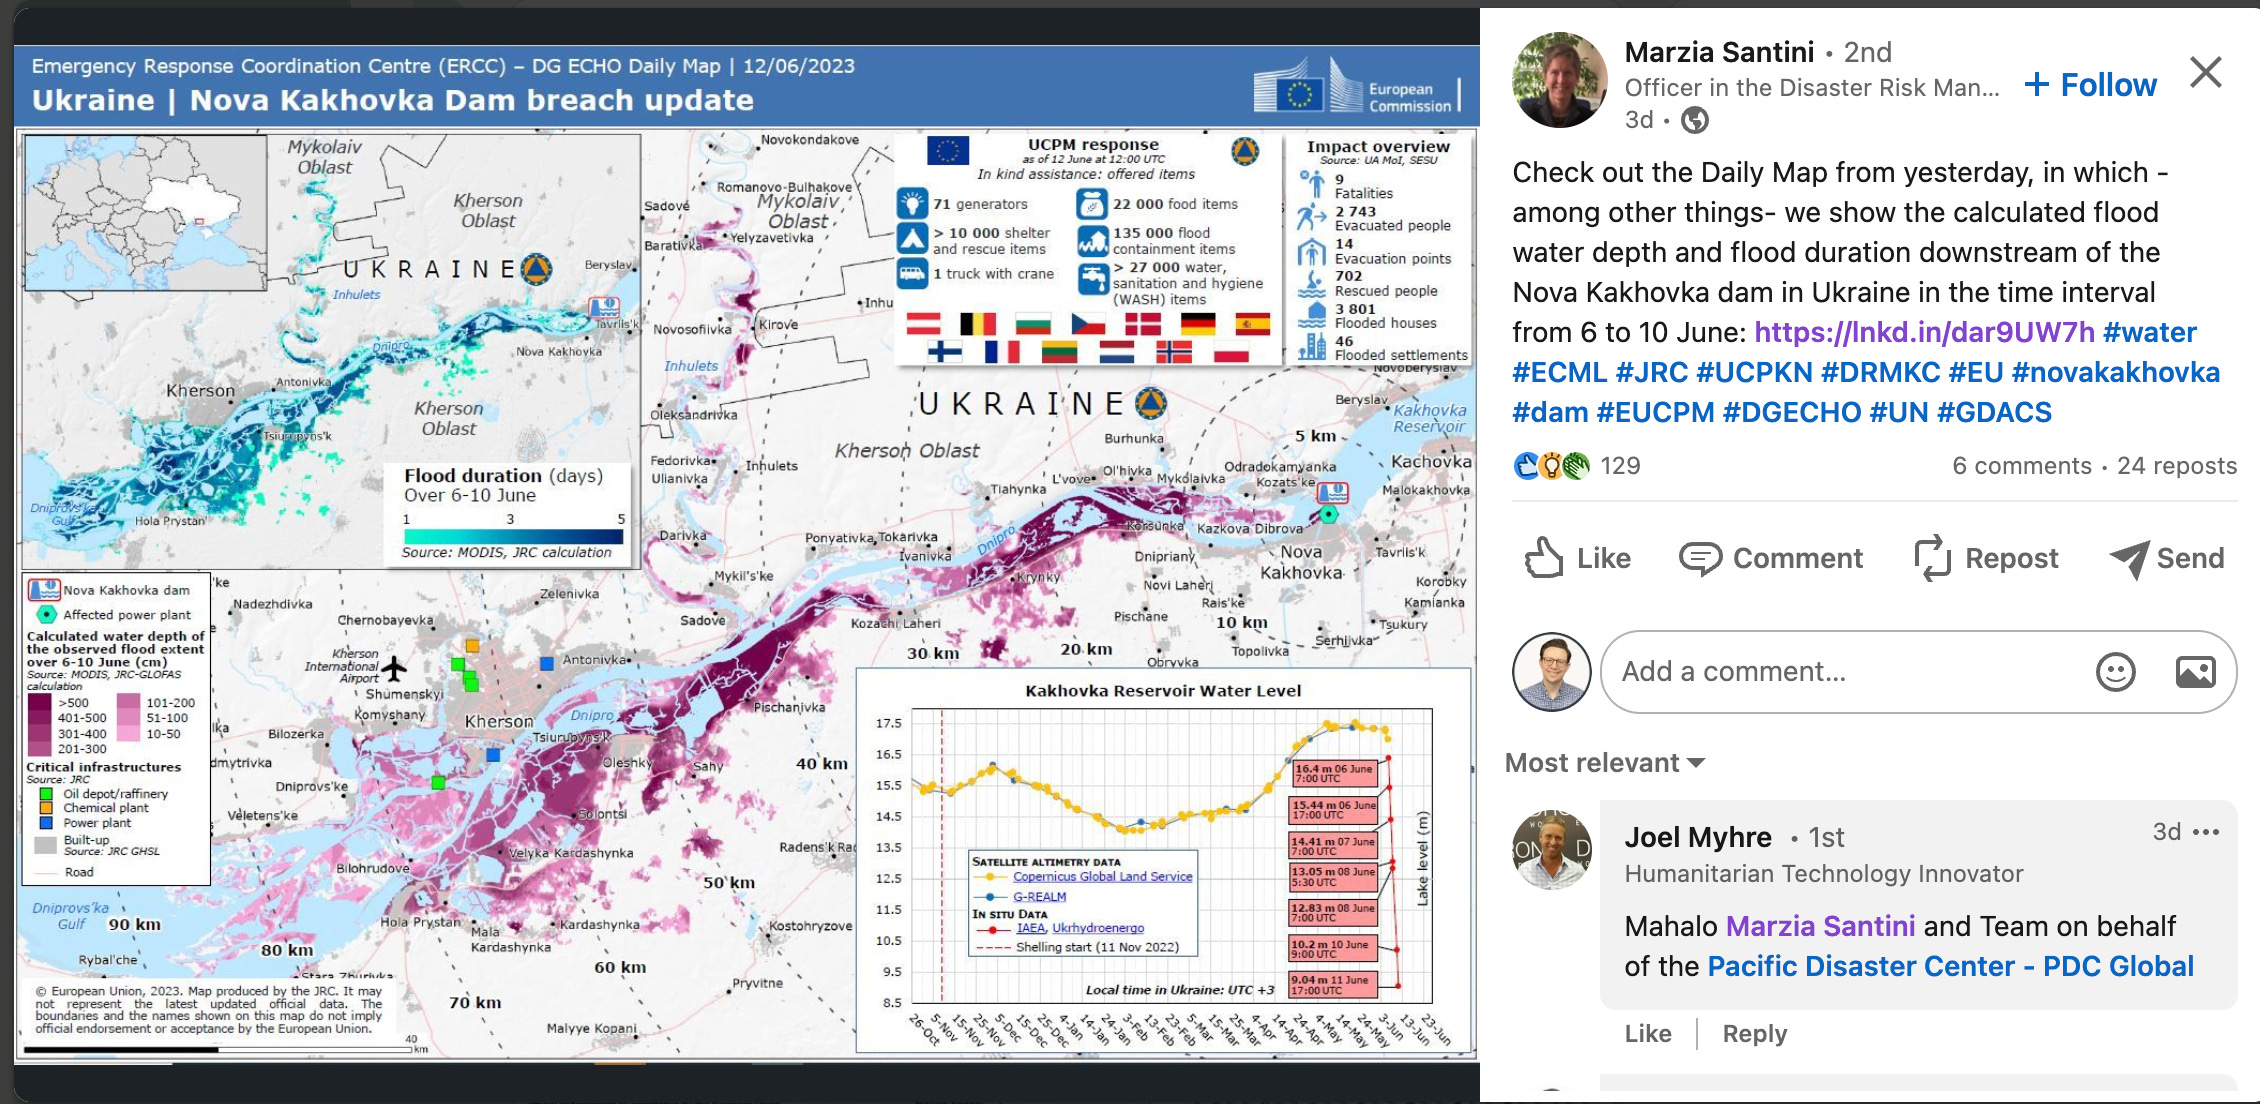
Quickly understanding a crisis in Ukraine
The flooding resulting from the Kakhovka dam collapse near Kherson caused a major humanitarian crisis with cities and drinking water being immediately impacted. With accurate and timely imagery response efforts can be focused with accurate data as seen in this map posted by Marzia Santini from the European Commission.
But the potentially greater impact goes beyond the floods to the areas that are supplied water from the dam, namely canal-based irrigation to crops in the region. As stated in this post from Planet:
In fact, NASA Harvest’s satellite-based analysis shows that three of the four major canal inlets vital for farm irrigation are already disconnected, with the fourth dangerously close to joining the list in the coming days. Canal-based irrigation is heavily relied upon in the summer, and summer rains are unlikely to be sufficient to maintain crop health and average yields in the previously-irrigated lands in this part of Ukraine.
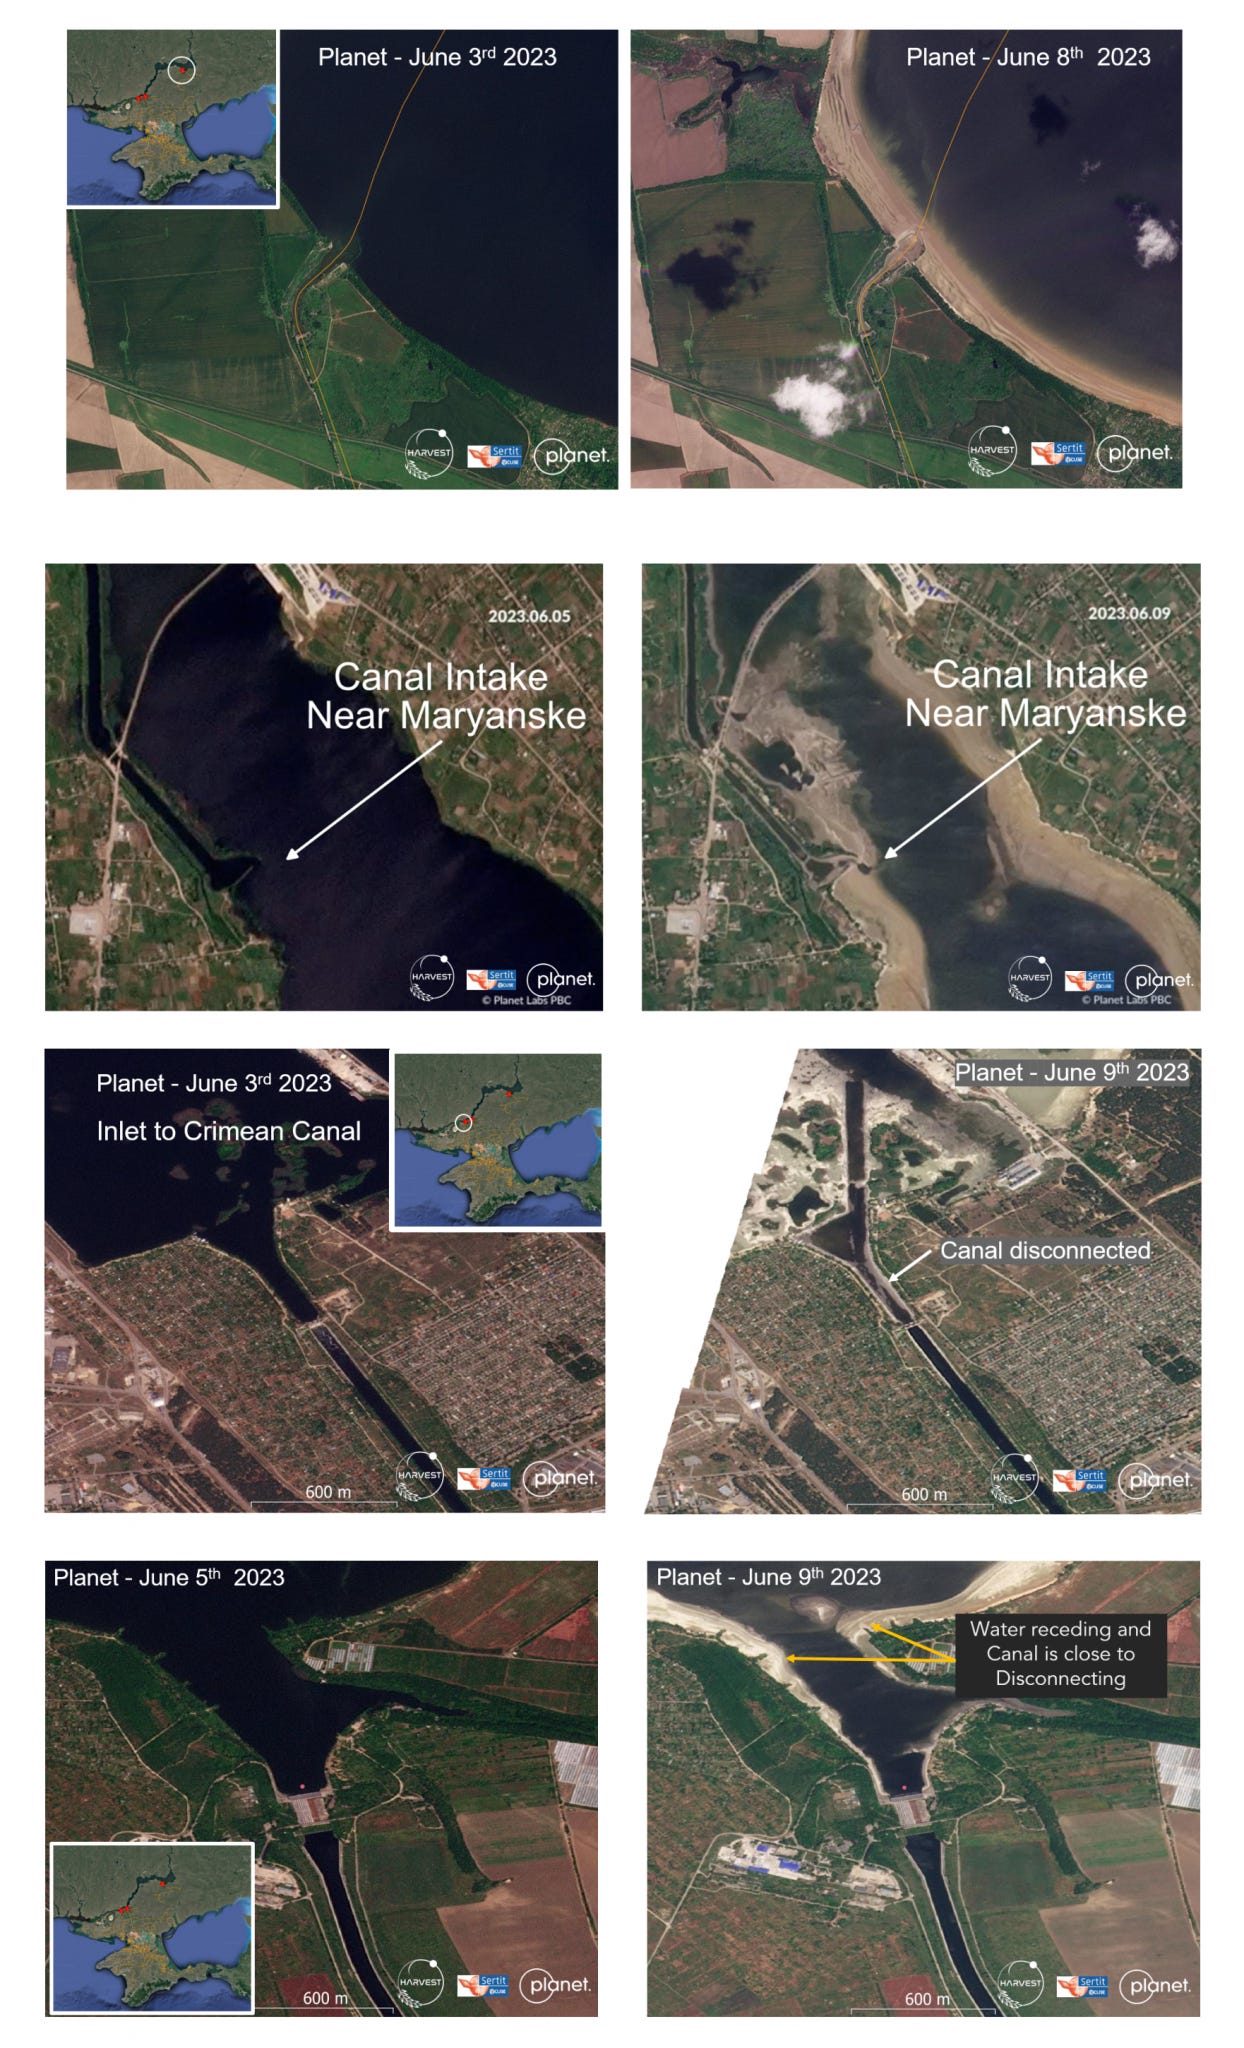
You can see here how detailed and timely imagery can make such an impact in situations like this.
Time matters
That leads into my next point which is that it is important to use that data to stay up to date. I saw this post on other social outlets outside the geospatial world (aka Instagram) the past few weeks about this giant clothing pile in the Atacama Desert in Chile.


The one issue is that even though many outlets reported that it is growing, it is now no longer there, and the reason why is even more problematic.
Bill Eerdmans, a leading voice in this space and someone I recommend following, actually went and pulled imagery from the site from 2017 to June 2022. Over that time the pile shrinks because the pile was progressively being burned. In Bill’s own words:
🔥 What was more shocking, in two shots (one of which was 10 days after the SkyFi image was taken in January 2022) it is clearly seen the piles are being burnt and the last of them disappeared around June of 2022. Since then, the area is vacant. This wasn't a dump, this was a open pit burn site for chemically treated garments. The environmental & community harm from this operation is sickening.
While the images of the clothing piles are striking, perhaps the plumes of smoke in the final frames of this GIF are the real story to focus on, and why a stream of frequent data that can be analyzed and monitored is critically important.
Yes, but space junk
And one last item to close out the post. While we spend a lot of time looking at what is on the earth, it is important to know what is above it. And Liam Peters shared this post this week showing exactly what that looks like in a video from LeoLabs.
Something else
Working on some new ideas for this Substack but would love to hear from you in the chat! In the meantime, here is another great GIS meme for your viewing pleasure.
Thanks!
If you have something you want to share or a job you want to promote you can e-mail me here. Or if you want to sponsor a newsletter, video, or post, check out this link to get in touch.